Trial>> x = linspace(0,2*pi,25)
Result:
x =
Columns 1 through 11
0 0.2618 0.5236 0.7854 1.0472 1.3090 1.5708 1.8326 2.0944 2.3562 2.6180
Columns 12 through 22
2.8798 3.1416 3.4034 3.6652 3.9270 4.1888 4.4506 4.7124 4.9742 5.2360 5.4978
Columns 23 through 25
5.7596 6.0214 6.2832
Command:
Trial>> y = sin(x)
Result:
y =
Columns 1 through 11
0 0.2588 0.5000 0.7071 0.8660 0.9659 1.0000 0.9659 0.8660 0.7071 0.5000
Columns 12 through 22
0.2588 0.0000 -0.2588 -0.5000 -0.7071 -0.8660 -0.9659 -1.0000 -0.9659 -0.8660 -0.7071
Columns 23 through 25
-0.5000 -0.2588 -0.0000
Command:
Trial>> figure
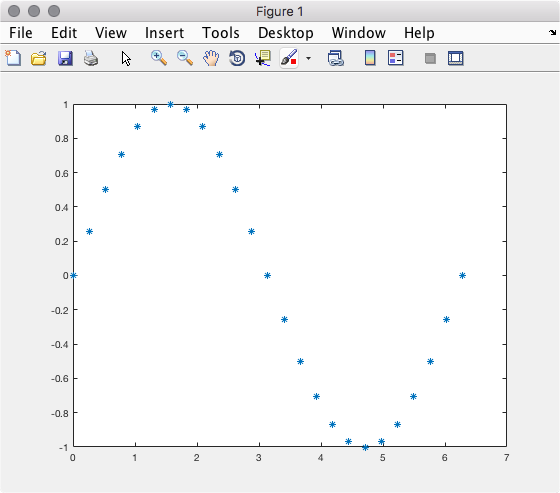
Trial>> plot(x,y,'*')
Result:

