Showing posts with label matplotlib. Show all posts

Thursday, September 29, 2016

Python: Matplotlib: Mathtext Examples

Noteworthy:

matplotlib.pyplot.fill_between()


Command:

$ cat Downloads/mathtext_examples.py


Result:

"""
Selected features of Matplotlib's math rendering engine.
"""
from __future__ import print_function
import matplotlib.pyplot as plt
import os
import sys
import re
import gc

# Selection of features following "Writing mathematical expressions" tutorial
mathtext_titles = {
    0: "Header demo",
    1: "Subscripts and superscripts",
    2: "Fractions, binomials and stacked numbers",
    3: "Radicals",
    4: "Fonts",
    5: "Accents",
    6: "Greek, Hebrew",
    7: "Delimiters, functions and Symbols"}
n_lines = len(mathtext_titles)

# Randomly picked examples
mathext_demos = {
    0: r"$W^{3\beta}_{\delta_1 \rho_1 \sigma_2} = "
    r"U^{3\beta}_{\delta_1 \rho_1} + \frac{1}{8 \pi 2} "
    r"\int^{\alpha_2}_{\alpha_2} d \alpha^\prime_2 \left[\frac{ "
    r"U^{2\beta}_{\delta_1 \rho_1} - \alpha^\prime_2U^{1\beta}_"
    r"{\rho_1 \sigma_2} }{U^{0\beta}_{\rho_1 \sigma_2}}\right]$",

    1: r"$\alpha_i > \beta_i,\ "
    r"\alpha_{i+1}^j = {\rm sin}(2\pi f_j t_i) e^{-5 t_i/\tau},\ "
    r"\ldots$",

    2: r"$\frac{3}{4},\ \binom{3}{4},\ \stackrel{3}{4},\ "
    r"\left(\frac{5 - \frac{1}{x}}{4}\right),\ \ldots$",

    3: r"$\sqrt{2},\ \sqrt[3]{x},\ \ldots$",

    4: r"$\mathrm{Roman}\ , \ \mathit{Italic}\ , \ \mathtt{Typewriter} \ "
    r"\mathrm{or}\ \mathcal{CALLIGRAPHY}$",

    5: r"$\acute a,\ \bar a,\ \breve a,\ \dot a,\ \ddot a, \ \grave a, \ "
    r"\hat a,\ \tilde a,\ \vec a,\ \widehat{xyz},\ \widetilde{xyz},\ "
    r"\ldots$",

    6: r"$\alpha,\ \beta,\ \chi,\ \delta,\ \lambda,\ \mu,\ "
    r"\Delta,\ \Gamma,\ \Omega,\ \Phi,\ \Pi,\ \Upsilon,\ \nabla,\ "
    r"\aleph,\ \beth,\ \daleth,\ \gimel,\ \ldots$",

    7: r"$\coprod,\ \int,\ \oint,\ \prod,\ \sum,\ "
    r"\log,\ \sin,\ \approx,\ \oplus,\ \star,\ \varpropto,\ "
    r"\infty,\ \partial,\ \Re,\ \leftrightsquigarrow, \ \ldots$"}


def doall():
    # Colors used in mpl online documentation.
    mpl_blue_rvb = (191./255., 209./256., 212./255.)
    mpl_orange_rvb = (202/255., 121/256., 0./255.)
    mpl_grey_rvb = (51./255., 51./255., 51./255.)

    # Creating figure and axis.
    plt.figure(figsize=(6, 7))
    plt.axes([0.01, 0.01, 0.98, 0.90], axisbg="white", frameon=True)
    plt.gca().set_xlim(0., 1.)
    plt.gca().set_ylim(0., 1.)
    plt.gca().set_title("Matplotlib's math rendering engine",
                        color=mpl_grey_rvb, fontsize=14, weight='bold')
    plt.gca().set_xticklabels("", visible=False)
    plt.gca().set_yticklabels("", visible=False)

    # Gap between lines in axes coords
    line_axesfrac = (1. / (n_lines))

    # Plotting header demonstration formula
    full_demo = mathext_demos[0]
    plt.annotate(full_demo,
                 xy=(0.5, 1. - 0.59*line_axesfrac),
                 xycoords='data', color=mpl_orange_rvb, ha='center',
                 fontsize=20)

    # Plotting features demonstration formulae
    for i_line in range(1, n_lines):
        baseline = 1. - (i_line)*line_axesfrac
        baseline_next = baseline - line_axesfrac*1.
        title = mathtext_titles[i_line] + ":"
        fill_color = ['white', mpl_blue_rvb][i_line % 2]
        plt.fill_between([0., 1.], [baseline, baseline],
                         [baseline_next, baseline_next],
                         color=fill_color, alpha=0.5)
        plt.annotate(title,
                     xy=(0.07, baseline - 0.3*line_axesfrac),
                     xycoords='data', color=mpl_grey_rvb, weight='bold')
        demo = mathext_demos[i_line]
        plt.annotate(demo,
                     xy=(0.05, baseline - 0.75*line_axesfrac),
                     xycoords='data', color=mpl_grey_rvb,
                     fontsize=16)

    for i in range(n_lines):
        s = mathext_demos[i]
        print(i, s)
    plt.savefig('pyplot_mathtext_examples.png')

if '--latex' in sys.argv:
    # Run: python mathtext_examples.py --latex
    # Need amsmath and amssymb packages.
    fd = open("mathtext_examples.ltx", "w")
    fd.write("\\documentclass{article}\n")
    fd.write("\\usepackage{amsmath, amssymb}\n")
    fd.write("\\begin{document}\n")
    fd.write("\\begin{enumerate}\n")

    for i in range(n_lines):
        s = mathext_demos[i]
        s = re.sub(r"(?<!\\)\$", "$$", s)
        fd.write("\\item %s\n" % s)

    fd.write("\\end{enumerate}\n")
    fd.write("\\end{document}\n")
    fd.close()

    os.system("pdflatex mathtext_examples.ltx")
else:
    doall()


Command:

$ python Downloads/mathtext_examples.py


Result:

0 $W^{3\beta}_{\delta_1 \rho_1 \sigma_2} = U^{3\beta}_{\delta_1 \rho_1} + \frac{1}{8 \pi 2} \int^{\alpha_2}_{\alpha_2} d \alpha^\prime_2 \left[\frac{ U^{2\beta}_{\delta_1 \rho_1} - \alpha^\prime_2U^{1\beta}_{\rho_1 \sigma_2} }{U^{0\beta}_{\rho_1 \sigma_2}}\right]$
1 $\alpha_i > \beta_i,\ \alpha_{i+1}^j = {\rm sin}(2\pi f_j t_i) e^{-5 t_i/\tau},\ \ldots$
2 $\frac{3}{4},\ \binom{3}{4},\ \stackrel{3}{4},\ \left(\frac{5 - \frac{1}{x}}{4}\right),\ \ldots$
3 $\sqrt{2},\ \sqrt[3]{x},\ \ldots$
4 $\mathrm{Roman}\ , \ \mathit{Italic}\ , \ \mathtt{Typewriter} \ \mathrm{or}\ \mathcal{CALLIGRAPHY}$
5 $\acute a,\ \bar a,\ \breve a,\ \dot a,\ \ddot a, \ \grave a, \ \hat a,\ \tilde a,\ \vec a,\ \widehat{xyz},\ \widetilde{xyz},\ \ldots$
6 $\alpha,\ \beta,\ \chi,\ \delta,\ \lambda,\ \mu,\ \Delta,\ \Gamma,\ \Omega,\ \Phi,\ \Pi,\ \Upsilon,\ \nabla,\ \aleph,\ \beth,\ \daleth,\ \gimel,\ \ldots$
7 $\coprod,\ \int,\ \oint,\ \prod,\ \sum,\ \log,\ \sin,\ \approx,\ \oplus,\ \star,\ \varpropto,\ \infty,\ \partial,\ \Re,\ \leftrightsquigarrow, \ \ldots$


Graphical output:

pyplot_mathtext_examples.png


Python: Matplotlib: XKCD-Style Sketch Plot Example

Noteworthy:

matplotlib.pyplot.xkcd()
matplotlib.pyplot.annotate()


Command:

$ cat Downloads/xkcd.py


Result:

import matplotlib.pyplot as plt
import numpy as np

with plt.xkcd():
    # Based on "Stove Ownership" from XKCD by Randall Monroe
    # http://xkcd.com/418/

    fig = plt.figure()
    ax = fig.add_axes((0.1, 0.2, 0.8, 0.7))
    ax.spines['right'].set_color('none')
    ax.spines['top'].set_color('none')
    plt.xticks([])
    plt.yticks([])
    ax.set_ylim([-30, 10])

    data = np.ones(100)
    data[70:] -= np.arange(30)

    plt.annotate(
        'THE DAY I REALIZED\nI COULD COOK BACON\nWHENEVER I WANTED',
        xy=(70, 1), arrowprops=dict(arrowstyle='->'), xytext=(15, -10))

    plt.plot(data)

    plt.xlabel('time')
    plt.ylabel('my overall health')
    fig.text(
        0.5, 0.05,
        '"Stove Ownership" from xkcd by Randall Monroe',
        ha='center')

    plt.savefig('pyplot_xkcd_figure1.png')

    # Based on "The Data So Far" from XKCD by Randall Monroe
    # http://xkcd.com/373/

    fig = plt.figure()
    ax = fig.add_axes((0.1, 0.2, 0.8, 0.7))
    ax.bar([-0.125, 1.0 - 0.125], [0, 100], 0.25)
    ax.spines['right'].set_color('none')
    ax.spines['top'].set_color('none')
    ax.xaxis.set_ticks_position('bottom')
    ax.set_xticks([0, 1])
    ax.set_xlim([-0.5, 1.5])
    ax.set_ylim([0, 110])
    ax.set_xticklabels(['CONFIRMED BY\nEXPERIMENT', 'REFUTED BY\nEXPERIMENT'])
    plt.yticks([])

    plt.title("CLAIMS OF SUPERNATURAL POWERS")

    fig.text(
        0.5, 0.05,
        '"The Data So Far" from xkcd by Randall Monroe',
        ha='center')
   
    plt.savefig('pyplot_xkcd_figure2.png')

plt.show()


Graphical output:

pyplot_xkcd_figure1.png
pyplot_xkcd_figure2.png

Python: Matplotlib: Polar Plot Example

Noteworthy:

ax.set_rmax()


Command:

$ cat Downloads/polar_demo.py


Result:

"""
Demo of a line plot on a polar axis.
"""
import numpy as np
import matplotlib.pyplot as plt

plt.style.use('dark_background')
r = np.arange(0, 3.0, 0.01)
theta = 2 * np.pi * r

ax = plt.subplot(111, projection='polar')
ax.plot(theta, r, color='r', linewidth=3)
ax.set_rmax(2.0)
ax.grid(True)

ax.set_title("A line plot on a polar axis", va='bottom')
plt.savefig('pyplot_polar_demo.png')


Graphical output:

pyplot_polar_demo.png

Python: Matplotlib: Logarithm Example

Noteworthy:

matplotlib.pyplot.subplots_adjust()
numpy.arange()
matplotlib.pyplot.semilogy()
matplotlib.pyplot.semilogx()
matplotlib.pyplot.loglog()
matplotlib.pyplot.errorbar()


Command:

$ cat Downloads/log_demo.py


Result:

import numpy as np
import matplotlib.pyplot as plt

plt.style.use('dark_background')
plt.subplots_adjust(hspace=0.4)
t = np.arange(0.01, 20.0, 0.01)

# log y axis
plt.subplot(221)
plt.semilogy(t, np.exp(-t/5.0))
plt.title('semilogy')
plt.grid(True)

# log x axis
plt.subplot(222)
plt.semilogx(t, np.sin(2*np.pi*t))
plt.title('semilogx')
plt.grid(True)

# log x and y axis
plt.subplot(223)
plt.loglog(t, 20*np.exp(-t/10.0), basex=2)
plt.grid(True)
plt.title('loglog base 4 on x')

# with errorbars: clip non-positive values
ax = plt.subplot(224)
ax.set_xscale("log", nonposx='clip')
ax.set_yscale("log", nonposy='clip')

x = 10.0**np.linspace(0.0, 2.0, 20)
y = x**2.0
plt.errorbar(x, y, xerr=0.1*x, yerr=5.0 + 0.75*y)
ax.set_ylim(ymin=0.1)
ax.set_title('Errorbars go negative')

plt.savefig('pyplot_log_demo.png')


Command:

$ python Downloads/log_demo.py


Graphical output:

pyplot_log_demo..png


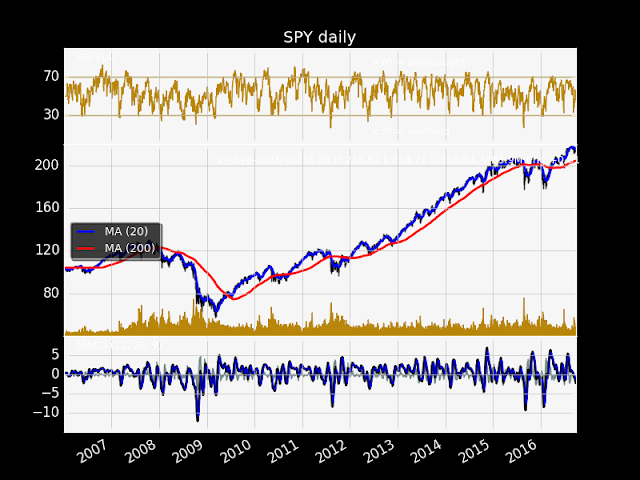
Python: Matplotlib: Finance Example

Noteworthy:

datetime.date(2006, 1, 1)
datetime.date.today()
finance.fetch_historical_yahoo(ticker, startdate, enddate)
mlab.csv2rec(fh)
fh.close()
r.sort()
np.asarray(x)
np.ones(n)
weights.sum()
np.convolve(x, weights, mode='full')[:len(x)]
np.diff(prices)
np.zeros_like(prices)
...


Command:

$ cat Downloads/finance_work2.py


Result:

import datetime
import numpy as np
import matplotlib.colors as colors
import matplotlib.finance as finance
import matplotlib.dates as mdates
import matplotlib.ticker as mticker
import matplotlib.mlab as mlab
import matplotlib.pyplot as plt
import matplotlib.font_manager as font_manager

plt.style.use('dark_background')

startdate = datetime.date(2006, 1, 1)
today = enddate = datetime.date.today()
ticker = 'SPY'

fh = finance.fetch_historical_yahoo(ticker, startdate, enddate)
# a numpy record array with fields: date, open, high, low, close, volume, adj_close)

r = mlab.csv2rec(fh)
fh.close()
r.sort()

def moving_average(x, n, type='simple'):
    """
    compute an n period moving average.

    type is 'simple' | 'exponential'

    """
    x = np.asarray(x)
    if type == 'simple':
        weights = np.ones(n)
    else:
        weights = np.exp(np.linspace(-1., 0., n))

    weights /= weights.sum()

    a = np.convolve(x, weights, mode='full')[:len(x)]
    a[:n] = a[n]
    return a

def relative_strength(prices, n=14):
    """
    compute the n period relative strength indicator
    http://stockcharts.com/school/doku.php?id=chart_school:glossary_r#relativestrengthindex
    http://www.investopedia.com/terms/r/rsi.asp
    """

    deltas = np.diff(prices)
    seed = deltas[:n+1]
    up = seed[seed >= 0].sum()/n
    down = -seed[seed < 0].sum()/n
    rs = up/down
    rsi = np.zeros_like(prices)
    rsi[:n] = 100. - 100./(1. + rs)

    for i in range(n, len(prices)):
        delta = deltas[i - 1]  # cause the diff is 1 shorter

        if delta > 0:
            upval = delta
            downval = 0.
        else:
            upval = 0.
            downval = -delta

        up = (up*(n - 1) + upval)/n
        down = (down*(n - 1) + downval)/n

        rs = up/down
        rsi[i] = 100. - 100./(1. + rs)

    return rsi

def moving_average_convergence(x, nslow=26, nfast=12):
    """
    compute the MACD (Moving Average Convergence/Divergence) using a fast and slow exponential moving avg'
    return value is emaslow, emafast, macd which are len(x) arrays
    """
    emaslow = moving_average(x, nslow, type='exponential')
    emafast = moving_average(x, nfast, type='exponential')
    return emaslow, emafast, emafast - emaslow

plt.rc('axes', grid=True)
plt.rc('grid', color='0.75', linestyle='-', linewidth=0.5)

textsize = 9
left, width = 0.1, 0.8
rect1 = [left, 0.7, width, 0.2]
rect2 = [left, 0.3, width, 0.4]
rect3 = [left, 0.1, width, 0.2]

fig = plt.figure(facecolor='white')
axescolor = '#f6f6f6'  # the axes background color

ax1 = fig.add_axes(rect1, axisbg=axescolor)  # left, bottom, width, height
ax2 = fig.add_axes(rect2, axisbg=axescolor, sharex=ax1)
ax2t = ax2.twinx()
ax3 = fig.add_axes(rect3, axisbg=axescolor, sharex=ax1)

# plot the relative strength indicator
prices = r.adj_close
rsi = relative_strength(prices)
fillcolor = 'darkgoldenrod'

ax1.plot(r.date, rsi, color=fillcolor)
ax1.axhline(70, color=fillcolor)
ax1.axhline(30, color=fillcolor)
ax1.fill_between(r.date, rsi, 70, where=(rsi >= 70), facecolor=fillcolor, edgecolor=fillcolor)
ax1.fill_between(r.date, rsi, 30, where=(rsi <= 30), facecolor=fillcolor, edgecolor=fillcolor)
ax1.text(0.6, 0.9, '>70 = overbought', va='top', transform=ax1.transAxes, fontsize=textsize)
ax1.text(0.6, 0.1, '<30 = oversold', transform=ax1.transAxes, fontsize=textsize)
ax1.set_ylim(0, 100)
ax1.set_yticks([30, 70])
ax1.text(0.025, 0.95, 'RSI (14)', va='top', transform=ax1.transAxes, fontsize=textsize)
ax1.set_title('%s daily' % ticker)

# plot the price and volume data
dx = r.adj_close - r.close
low = r.low + dx
high = r.high + dx

deltas = np.zeros_like(prices)
deltas[1:] = np.diff(prices)
up = deltas > 0
ax2.vlines(r.date[up], low[up], high[up], color='black', label='_nolegend_')
ax2.vlines(r.date[~up], low[~up], high[~up], color='black', label='_nolegend_')
ma20 = moving_average(prices, 20, type='simple')
ma200 = moving_average(prices, 200, type='simple')

linema20, = ax2.plot(r.date, ma20, color='blue', lw=2, label='MA (20)')
linema200, = ax2.plot(r.date, ma200, color='red', lw=2, label='MA (200)')

last = r[-1]
s = '%s O:%1.2f H:%1.2f L:%1.2f C:%1.2f, V:%1.1fM Chg:%+1.2f' % (
    today.strftime('%d-%b-%Y'),
    last.open, last.high,
    last.low, last.close,
    last.volume*1e-6,
    last.close - last.open)
t4 = ax2.text(0.3, 0.9, s, transform=ax2.transAxes, fontsize=textsize)

props = font_manager.FontProperties(size=10)
leg = ax2.legend(loc='center left', shadow=True, fancybox=True, prop=props)
leg.get_frame().set_alpha(0.5)

volume = (r.close*r.volume)/1e6  # dollar volume in millions
vmax = volume.max()
poly = ax2t.fill_between(r.date, volume, 0, label='Volume', facecolor=fillcolor, edgecolor=fillcolor)
ax2t.set_ylim(0, 5*vmax)
ax2t.set_yticks([])

# compute the MACD indicator
fillcolor = 'darkslategrey'
nslow = 26
nfast = 12
nema = 9
emaslow, emafast, macd = moving_average_convergence(prices, nslow=nslow, nfast=nfast)
ema9 = moving_average(macd, nema, type='exponential')
ax3.plot(r.date, macd, color='black', lw=2)
ax3.plot(r.date, ema9, color='blue', lw=1)
ax3.fill_between(r.date, macd - ema9, 0, alpha=0.5, facecolor=fillcolor, edgecolor=fillcolor)

ax3.text(0.025, 0.95, 'MACD (%d, %d, %d)' % (nfast, nslow, nema), va='top',
         transform=ax3.transAxes, fontsize=textsize)

#ax3.set_yticks([])
# turn off upper axis tick labels, rotate the lower ones, etc
for ax in ax1, ax2, ax2t, ax3:
    if ax != ax3:
        for label in ax.get_xticklabels():
            label.set_visible(False)
    else:
        for label in ax.get_xticklabels():
            label.set_rotation(30)
            label.set_horizontalalignment('right')

    ax.fmt_xdata = mdates.DateFormatter('%Y-%m-%d')

class MyLocator(mticker.MaxNLocator):
    def __init__(self, *args, **kwargs):
        mticker.MaxNLocator.__init__(self, *args, **kwargs)

    def __call__(self, *args, **kwargs):
        return mticker.MaxNLocator.__call__(self, *args, **kwargs)

# at most 5 ticks, pruning the upper and lower so they don't overlap
# with other ticks
#ax2.yaxis.set_major_locator(mticker.MaxNLocator(5, prune='both'))
#ax3.yaxis.set_major_locator(mticker.MaxNLocator(5, prune='both'))

ax2.yaxis.set_major_locator(MyLocator(5, prune='both'))
ax3.yaxis.set_major_locator(MyLocator(5, prune='both'))

plt.savefig("pyplot_finance_work2.png")


Graphical output:

pyplot_finance_work2.png


Python: Matplotlib: Fill Example

Noteworthy:

matplotlib.pyplot.fill()


Command:

$ cat Downloads/fill_demo.py


Result:

"""
Simple demo of the fill function.
"""
import numpy as np
import matplotlib.pyplot as plt

plt.style.use('dark_background')

x = np.linspace(0, 1)
y = np.sin(4 * np.pi * x) * np.exp(-5 * x)

plt.fill(x, y, 'r')
plt.grid(True)

plt.savefig("pyplot_fill.png")


Command:

$ python Downloads/fill_demo.py 
$ open pyplot_fill.png 


Graphical output:


Python: Matplotlib: Pie Chart Example

Noteworthy:

matplotlib.pyplot.pie()
ax.pie()
ax.set_xticks()
ax.set_yticks()
ax.set_xticklabels()
ax.set_yticklabels()
ax.set_xlim()
ax.set_ylim()
ax.set_aspect()


Command:

$ cat Downloads/pie_demo_features.py


Result:

"""
Demo of a basic pie chart plus a few additional features.

In addition to the basic pie chart, this demo shows a few optional features:

    * slice labels
    * auto-labeling the percentage
    * offsetting a slice with "explode"
    * drop-shadow
    * custom start angle

Note about the custom start angle:

The default ``startangle`` is 0, which would start the "Frogs" slice on the
positive x-axis. This example sets ``startangle = 90`` such that everything is
rotated counter-clockwise by 90 degrees, and the frog slice starts on the
positive y-axis.
"""
import matplotlib.pyplot as plt

plt.style.use('dark_background')

# The slices will be ordered and plotted counter-clockwise.
labels = 'Frogs', 'Hogs', 'Dogs', 'Logs'
sizes = [15, 30, 45, 10]
colors = ['yellowgreen', 'gold', 'lightskyblue', 'lightcoral']
explode = (0, 0.1, 0, 0)  # only "explode" the 2nd slice (i.e. 'Hogs')

plt.pie(sizes, explode=explode, labels=labels, colors=colors,
        autopct='%1.1f%%', shadow=True, startangle=90)
# Set aspect ratio to be equal so that pie is drawn as a circle.
plt.axis('equal')

fig = plt.figure()
ax = fig.gca()
import numpy as np

ax.pie(np.random.random(4), explode=explode, labels=labels, colors=colors,
       autopct='%1.1f%%', shadow=True, startangle=90,
       radius=0.25, center=(0, 0), frame=True)
ax.pie(np.random.random(4), explode=explode, labels=labels, colors=colors,
       autopct='%1.1f%%', shadow=True, startangle=90,
       radius=0.25, center=(1, 1), frame=True)
ax.pie(np.random.random(4), explode=explode, labels=labels, colors=colors,
       autopct='%1.1f%%', shadow=True, startangle=90,
       radius=0.25, center=(0, 1), frame=True)
ax.pie(np.random.random(4), explode=explode, labels=labels, colors=colors,
       autopct='%1.1f%%', shadow=True, startangle=90,
       radius=0.25, center=(1, 0), frame=True)

ax.set_xticks([0, 1])
ax.set_yticks([0, 1])
ax.set_xticklabels(["Sunny", "Cloudy"])
ax.set_yticklabels(["Dry", "Rainy"])
ax.set_xlim((-0.5, 1.5))
ax.set_ylim((-0.5, 1.5))

# Set aspect ratio to be equal so that pie is drawn as a circle.
ax.set_aspect('equal')

plt.show()


Command:

$ python Downloads/pie_demo_features.py


Graphical output:

Figure 1
Figure 2


Python: Matplotlib: Path Example

Noteworthy:

matplotlib.path.Path
Path.MOVETO
Path.CURVE4
Path.LINETO
Path.CLOSEPOLY
matplotlib.patches.PathPatch()
ax.add_patch()
zip()
path.vertices
ax.grid()
ax.axis()


Command:

$ cat Downloads/path_patch_demo.py


Result:

"""
Demo of a PathPatch object.
"""
import matplotlib.path as mpath
import matplotlib.patches as mpatches
import matplotlib.pyplot as plt

plt.style.use('dark_background')

fig, ax = plt.subplots()

Path = mpath.Path
path_data = [
    (Path.MOVETO, (1.58, -2.57)),
    (Path.CURVE4, (0.35, -1.1)),
    (Path.CURVE4, (-1.75, 2.0)),
    (Path.CURVE4, (0.375, 2.0)),
    (Path.LINETO, (0.85, 1.15)),
    (Path.CURVE4, (2.2, 3.2)),
    (Path.CURVE4, (3, 0.05)),
    (Path.CURVE4, (2.0, -0.5)),
    (Path.CLOSEPOLY, (1.58, -2.57)),
    ]
codes, verts = zip(*path_data)
path = mpath.Path(verts, codes)
patch = mpatches.PathPatch(path, facecolor='r', alpha=0.5)
ax.add_patch(patch)

# plot control points and connecting lines
x, y = zip(*path.vertices)
line, = ax.plot(x, y, 'go-')

ax.grid()
ax.axis('equal')
plt.show()


Command:

$ python Downloads/path_patch_demo.py


Graphical output:


Wednesday, September 28, 2016

Python: Matplotlib: Streamplot (2D Vector Field) Example

Noteworthy:

numpy.mgrid
numpy.sqrt
matplotlib.pyplot.subplots()
matplotlib.pyplot.cm.autumn
streamplot()
strm.linesspeed.max()


Command:

$ cat Downloads/streamplot_demo_features.py


Result:

"""
Demo of the `streamplot` function.

A streamplot, or streamline plot, is used to display 2D vector fields. This
example shows a few features of the stream plot function:

    * Varying the color along a streamline.
    * Varying the density of streamlines.
    * Varying the line width along a stream line.
"""
import numpy as np
import matplotlib.pyplot as plt

plt.style.use('dark_background')

Y, X = np.mgrid[-3:3:100j, -3:3:100j]
U = -1 - X**2 + Y
V = 1 + X - Y**2
speed = np.sqrt(U*U + V*V)

fig0, ax0 = plt.subplots()
strm = ax0.streamplot(X, Y, U, V, color=U, linewidth=2, cmap=plt.cm.autumn)
fig0.colorbar(strm.lines)

fig1, (ax1, ax2) = plt.subplots(ncols=2)
ax1.streamplot(X, Y, U, V, density=[0.5, 1])

lw = 5*speed / speed.max()
ax2.streamplot(X, Y, U, V, density=0.6, color='k', linewidth=lw)

plt.show()


Command:

$ python Downloads/streamplot_demo_features.py


Graphical output:

fig0

fig1 (w/ unknown error on right side)
fig1 (Normal background style)


Python: Matplotlib: Sine Function Example

Noteworthy:

numpy.sin()
numpy.pi


Command:

$ cat Downloads/simple_plot.py


Result:

import matplotlib.pyplot as plt
import numpy as np

t = np.arange(0.0, 2.0, 0.01)
s = np.sin(2*np.pi*t)
plt.plot(t, s)

plt.xlabel('time (s)')
plt.ylabel('voltage (mV)')
plt.title('About as simple as it gets, folks')
plt.grid(True)
plt.savefig("test.png")
plt.show()


Command:

$ python Downloads/simple_plot.py


Graphical output:

Python: Matplotlib: Lorenz Attractor Example

Noteworthy:

def
for in
range()
numpy.empty()
set_xlabel()
set_ylabel()
set_zlabel()
set_title()


Command:

$ cat Downloads/lorenz_attractor.py


Result:

# Plot of the Lorenz Attractor based on Edward Lorenz's 1963 "Deterministic
# Nonperiodic Flow" publication.
# http://journals.ametsoc.org/doi/abs/10.1175/1520-0469%281963%29020%3C0130%3ADNF%3E2.0.CO%3B2
#
# Note: Because this is a simple non-linear ODE, it would be more easily
#       done using SciPy's ode solver, but this approach depends only
#       upon NumPy.

import numpy as np
import matplotlib.pyplot as plt
from mpl_toolkits.mplot3d import Axes3D

plt.style.use('dark_background')

def lorenz(x, y, z, s=10, r=28, b=2.667):
    x_dot = s*(y - x)
    y_dot = r*x - y - x*z
    z_dot = x*y - b*z
    return x_dot, y_dot, z_dot


dt = 0.01
stepCnt = 10000

# Need one more for the initial values
xs = np.empty((stepCnt + 1,))
ys = np.empty((stepCnt + 1,))
zs = np.empty((stepCnt + 1,))

# Setting initial values
xs[0], ys[0], zs[0] = (0., 1., 1.05)

# Stepping through "time".
for i in range(stepCnt):
    # Derivatives of the X, Y, Z state
    x_dot, y_dot, z_dot = lorenz(xs[i], ys[i], zs[i])
    xs[i + 1] = xs[i] + (x_dot * dt)
    ys[i + 1] = ys[i] + (y_dot * dt)
    zs[i + 1] = zs[i] + (z_dot * dt)

fig = plt.figure()
ax = fig.gca(projection='3d')

ax.plot(xs, ys, zs)
ax.set_xlabel("X Axis")
ax.set_ylabel("Y Axis")
ax.set_zlabel("Z Axis")
ax.set_title("Lorenz Attractor")

plt.show()


Command:

$ python Downloads/lorenz_attractor.py


Graphical output:

Python: Matplotlib: Tri-Surface plots Example

Noteworthy:

# "Repeat elements of an array."
numpy.repeat(a, repeats, axis=None)

# "Append values to the end of an array."
numpy.append(arr, values, axis=None)

# "Create a tri-surface plot."
Axes3D.plot_trisurf(*args, **kwargs)


Command:

$ cat Downloads/trisurf3d_demo.py


Result:

from mpl_toolkits.mplot3d import Axes3D
from matplotlib import cm
import matplotlib.pyplot as plt
import numpy as np

plt.style.use('dark_background')
n_angles = 36
n_radii = 8

# An array of radii
# Does not include radius r=0, this is to eliminate duplicate points
radii = np.linspace(0.125, 1.0, n_radii)

# An array of angles
angles = np.linspace(0, 2*np.pi, n_angles, endpoint=False)

# Repeat all angles for each radius
angles = np.repeat(angles[..., np.newaxis], n_radii, axis=1)

# Convert polar (radii, angles) coords to cartesian (x, y) coords
# (0, 0) is added here. There are no duplicate points in the (x, y) plane
x = np.append(0, (radii*np.cos(angles)).flatten())
y = np.append(0, (radii*np.sin(angles)).flatten())

# Pringle surface
z = np.sin(-x*y)

fig = plt.figure()
ax = fig.gca(projection='3d')

ax.plot_trisurf(x, y, z, cmap=cm.jet, linewidth=0.2)

plt.show()


Command:

$ python Downloads/trisurf3d_demo.py


Graphical output:


Tuesday, September 27, 2016

Python: Matplotlib: 3D Plot Example

Noteworthy:

# "Creates a new figure."
matplotlib.pyplot.figure(num=None, figsize=None, dpi=None, facecolor=None, edgecolor=None, frameon=True, FigureClass=<class 'matplotlib.figure.Figure'>, **kwargs)

# "Renders into a FigureCanvas."
class matplotlib.figure.Figure(figsize=None, dpi=None, facecolor=None, edgecolor=None, linewidth=0.0, frameon=None, subplotpars=None, tight_layout=None)

# "Get the current Axes instance on the current figure matching the given keyword args, or create one."
matplotlib.pyplot.gca(**kwargs)

# "Return evenly spaced values within a given interval."
numpy.arange([start, ]stop, [step, ]dtype=None)

# "Return coordinate matrices from coordinate vectors."
numpy.meshgrid(*xi, **kwargs)

# "Return the positive square-root of an array, element-wise."
numpy.sqrt(x[, out]) = <ufunc 'sqrt'>

# "Trigonometric sine, element-wise."
numpy.sin(x[, out]) = <ufunc 'sin'>

# "Create a surface plot."
Axes3D.plot_surface(X, Y, Z, *args, **kwargs)


Command:

$ cat test3dplot.py


Result:

#!/usr/local/bin/python

from matplotlib import cm
from mpl_toolkits.mplot3d import Axes3D
import matplotlib.pyplot as plt
import numpy as np

plt.style.use('dark_background')
fig = plt.figure()
ax = fig.gca(projection='3d')
X = np.arange(-5, 5, 0.25)
Y = np.arange(-5, 5, 0.25)
X, Y = np.meshgrid(X, Y)
R = np.sqrt(X**2 + Y**2)
Z = np.sin(R)
surf = ax.plot_surface(X, Y, Z, rstride=1, cstride=1, cmap=cm.coolwarm)
plt.show()


Command:

$ python test3dplot.py

Graphical output:

Python: Matplotlib: Histogram Dark Background Example

Command:

$ cat testhistogram.py


Result:

#!/usr/local/bin/python

import matplotlib.pyplot as plt
plt.style.use('dark_background')

from numpy.random import normal,rand
x = normal(size=200)
plt.hist(x,bins=30)
plt.show()


Command:

$ python testhistogram.py


Graphical output:

Python: Matplotlib: Scatter Plot Dark Background Example

Command:

$ cat testscatterplot.py


Result:

#!/usr/local/bin/python

import matplotlib.pyplot as plt
plt.style.use('dark_background')

from numpy.random import rand
a = rand(100)
b = rand(100)
plt.scatter(a,b)
plt.show()


Command:

$ python testscatterplot.py


Graphical output:


Python: Matplotlib: Dark Background Example

Noteworthy:

# "Use matplotlib style settings from a style specification."
matplotlib.style.use(style)

# "Return the length (the number of items) of an object."
len(s)

# "An instance of RcParams for handling default matplotlib values."
matplotlib.rcParams

# "Set the x axis label of the current axis."
matplotlib.pyplot.xlabel(s, *args, **kwargs)

# "Set the y axis label of the current axis."
matplotlib.pyplot.ylabel(s, *args, **kwargs)

# "Set a title of the current axes."
matplotlib.pyplot.title(s, *args, **kwargs)


Command:

$ cat testdarkbackground.py


Result:

#!/usr/local/bin/python

import numpy as np
import matplotlib.pyplot as plt

plt.style.use('dark_background')

L = 6
x = np.linspace(0, L)
ncolors = len(plt.rcParams['axes.prop_cycle'])
shift = np.linspace(0, L, ncolors, endpoint=False)
for s in shift:
    plt.plot(x, np.sin(x + s), 'o-')
plt.xlabel('x-axis')
plt.ylabel('y-axis')
plt.title('title')

plt.show()


Command:

$ python testdarkbackground.py


Graphical output:

Python: Matplotlib: Scatter Plot Example

Noteworthy:

# "Random values in a given shape."
numpy.random.rand(d0, d1, ..., dn)

# "Make a scatter plot of x vs y, where x and y are sequence like objects of the same length."
matplotlib.pyplot.scatter(x, y, s=20, c=None, marker='o', cmap=None, norm=None, vmin=None, vmax=None, alpha=None, linewidths=None, verts=None, edgecolors=None, hold=None, data=None, **kwargs)


Command:

$ cat testscatterplot.py


Result:

#!/usr/local/bin/python

import matplotlib.pyplot as plt
from numpy.random import rand
a = rand(100)
b = rand(100)
plt.scatter(a,b)
plt.show()


Command:

$ python testscatterplot.py


Graphical output:

Python: Matplotlib: Histogram Example

Noteworthy:

# "Draw random samples from a normal (Gaussian) distribution."
# 正規分布(ガウス分布)からランダムにサンプルして線を描く。
numpy.random.normal(loc=0.0, scale=1.0, size=None)

# "Plot a histogram"
# ヒストグラムをプロット(描写)する。
matplotlib.pyplot.hist(x, bins=10, range=None, normed=False, weights=None, cumulative=False, bottom=None, histtype='bar', align='mid', orientation='vertical', rwidth=None, log=False, color=None, label=None, stacked=False, hold=None, data=None, **kwargs)


Command:

$ cat testhistogram.py


Result:

#!/usr/local/bin/python

import matplotlib.pyplot as plt
from numpy.random import normal,rand
x = normal(size=200)
plt.hist(x,bins=30)
plt.show()


Command:

$ python testhistogram.py


Graphical output:


Python: Matplotlib: Line Plot Example

Noteworthy:

# "Return evenly spaced numbers over a specified interval."
# 等間隔に並べた数字を返す。
numpy.linspace(start, stop, num=50, endpoint=True, retstep=False, dtype=None)

# "Calculate the exponential of all elements in the input array."
# 指数の計算
numpy.exp(x[, out]) = <ufunc 'exp'>

# "Display a figure."
# フィギュアを表示する。
matplotlib.pyplot.show(*args, **kw)


Command:

$ cat testlineplot.py


Result:

#!/usr/local/bin/python

import matplotlib.pyplot as plt
import numpy as np
a = np.linspace(0,10,100)
b = np.exp(-a)
plt.plot(a,b)
plt.show()


Graphical output:

macOS Sierra: Python: Plot and Save Image File Using Matplotlib

Noteworthy:

# Using AGG - The Anti-Grain Geometry (Agg) rendering engine
import matplotlib
matplotlib.use('Agg')

# Plot lines and/or markers to the Axes.
# args is a variable length argument, allowing for multiple x, y pairs with an optional format string.
import matplotlib.pyplot as plt
plt.plot(*args)

# Save the current figure
import matplotlib.pyplot as plt
plt.savefig(FILENAME)


Command:

$ cat testplotandsavefig.py


Result:

#!/usr/local/bin/python
import matplotlib
matplotlib.use('Agg')
import matplotlib.pyplot as plt
plt.plot([1,2,3])
plt.savefig('myfig')


Command:

$ chmod +x testplotandsavefig.py
$ ./testplotandsavefig.py


Result:

Traceback (most recent call last):
  File "./testplotandsavefig.py", line 2, in <module>
    import matplotlib
ImportError: No module named matplotlib


Command (Installing matplotlib):

$ brew install matplotlib


Result:

==> Auto-updated Homebrew!
Updated Homebrew from 6e57355 to e4ed309.
Updated 2 taps (homebrew/core, homebrew/science).
==> New Formulae
gofabric8                  httpdiff                   linkerd                
==> Updated Formulae
airspy                                   openssl ✔                            
antigen                                  openssl@1.1                          
argyll-cms                               pgrouting                            
cgal                                     postgis                              
chaiscript                               protobuf-swift                      
consul-template                          purescript                          
fzf                                      sfcgal                              
homebrew/science/exabayes                spdylay                              
homebrew/science/nextflow                storm                                
homebrew/science/sortmerna               the_silver_searcher                  
homebrew/science/vtk                     varnish                              
jetty                                    vim ✔                                
jsoncpp                                  wellington                          
launch                                   wolfssl                              
legit                                    yle-dl                              
libpointing                              you-get                              
mobile-shell                             zplug                                
nghttp2                              
==> Deleted Formulae
aeskeyfind

==> Installing matplotlib from homebrew/python
==> Downloading https://pypi.python.org/packages/source/m/matplotlib/matplotlib-
######################################################################## 100.0%
==> Downloading https://pypi.python.org/packages/source/s/setuptools/setuptools-
######################################################################## 100.0%
==> python -c import setuptools... --no-user-cfg install --prefix=/usr/local/Cel
==> Downloading https://pypi.python.org/packages/source/C/Cycler/cycler-0.9.0.ta
######################################################################## 100.0%
==> python -c import setuptools... --no-user-cfg install --prefix=/usr/local/Cel
==> Downloading https://pypi.python.org/packages/source/f/funcsigs/funcsigs-0.4.
######################################################################## 100.0%
==> python -c import setuptools... --no-user-cfg install --prefix=/usr/local/Cel
==> Downloading https://pypi.python.org/packages/source/n/nose/nose-1.3.7.tar.gz
######################################################################## 100.0%
==> python -c import setuptools... --no-user-cfg install --prefix=/usr/local/Cel
==> Downloading https://pypi.python.org/packages/source/m/mock/mock-1.3.0.tar.gz
######################################################################## 100.0%
==> python -c import setuptools... --no-user-cfg install --prefix=/usr/local/Cel
==> Downloading https://pypi.python.org/packages/source/p/pbr/pbr-1.8.1.tar.gz
######################################################################## 100.0%
==> python -c import setuptools... --no-user-cfg install --prefix=/usr/local/Cel
==> Downloading https://pypi.python.org/packages/source/p/pyparsing/pyparsing-2.
######################################################################## 100.0%
==> python -c import setuptools... --no-user-cfg install --prefix=/usr/local/Cel
==> Downloading https://pypi.python.org/packages/source/p/python-dateutil/python
######################################################################## 100.0%
==> python -c import setuptools... --no-user-cfg install --prefix=/usr/local/Cel
==> Downloading https://pypi.python.org/packages/source/p/pytz/pytz-2015.7.tar.b
######################################################################## 100.0%
==> python -c import setuptools... --no-user-cfg install --prefix=/usr/local/Cel
==> Downloading https://pypi.python.org/packages/source/s/six/six-1.10.0.tar.gz
######################################################################## 100.0%
==> python -c import setuptools... --no-user-cfg install --prefix=/usr/local/Cel
==> Caveats
If you want to use the `wxagg` backend, do `brew install wxpython`.
This can be done even after the matplotlib install.
==> Summary
🍺  /usr/local/Cellar/matplotlib/1.5.1: 3,513 files, 76.5M, built in 1 minute 15 seconds


Command:

$ ./testplotandsavefig.py


Result (Error):

Traceback (most recent call last):
  File "./testplotandsavefig.py", line 2, in <module>
    import matplotlib
  File "/usr/local/lib/python2.7/site-packages/matplotlib/__init__.py", line 1131, in <module>
    rcParams = rc_params()
  File "/usr/local/lib/python2.7/site-packages/matplotlib/__init__.py", line 975, in rc_params
    return rc_params_from_file(fname, fail_on_error)
  File "/usr/local/lib/python2.7/site-packages/matplotlib/__init__.py", line 1100, in rc_params_from_file
    config_from_file = _rc_params_in_file(fname, fail_on_error)
  File "/usr/local/lib/python2.7/site-packages/matplotlib/__init__.py", line 1018, in _rc_params_in_file
    with _open_file_or_url(fname) as fd:
  File "/usr/local/Cellar/python/2.7.12/Frameworks/Python.framework/Versions/2.7/lib/python2.7/contextlib.py", line 17, in __enter__
    return self.gen.next()
  File "/usr/local/lib/python2.7/site-packages/matplotlib/__init__.py", line 1000, in _open_file_or_url
    encoding = locale.getdefaultlocale()[1]
  File "/usr/local/Cellar/python/2.7.12/Frameworks/Python.framework/Versions/2.7/lib/python2.7/locale.py", line 545, in getdefaultlocale
    return _parse_localename(localename)
  File "/usr/local/Cellar/python/2.7.12/Frameworks/Python.framework/Versions/2.7/lib/python2.7/locale.py", line 477, in _parse_localename
    raise ValueError, 'unknown locale: %s' % localename
ValueError: unknown locale: UTF-8


Command:

$ locale


Result:

LANG=
LC_COLLATE="C"
LC_CTYPE="UTF-8"
LC_MESSAGES="C"
LC_MONETARY="C"
LC_NUMERIC="C"
LC_TIME="C"
LC_ALL=


Command (Fixing locale):

$ LC_CTYPE="C"
$ locale


Result:

LANG=
LC_COLLATE="C"
LC_CTYPE="C"
LC_MESSAGES="C"
LC_MONETARY="C"
LC_NUMERIC="C"
LC_TIME="C"
LC_ALL=


Command:

$ ./testplotandsavefig.py


Result:

/usr/local/lib/python2.7/site-packages/matplotlib/font_manager.py:273: UserWarning: Matplotlib is building the font cache using fc-list. This may take a moment.
  warnings.warn('Matplotlib is building the font cache using fc-list. This may take a moment.')


Command:

$ ls myfig*


Result:

myfig.png


Command (Opening image file):

$ open myfig.png