Noteworthy:
# Using AGG - The Anti-Grain Geometry (Agg) rendering engine
import matplotlib
matplotlib.use('Agg')
# Plot lines and/or markers to the Axes.
# args is a variable length argument, allowing for multiple x, y pairs with an optional format string.
import matplotlib.pyplot as plt
plt.plot(*args)
# Save the current figure
import matplotlib.pyplot as plt
plt.savefig(FILENAME)
Command:
$ cat testplotandsavefig.py
Result:
#!/usr/local/bin/python
import matplotlib
matplotlib.use('Agg')
import matplotlib.pyplot as plt
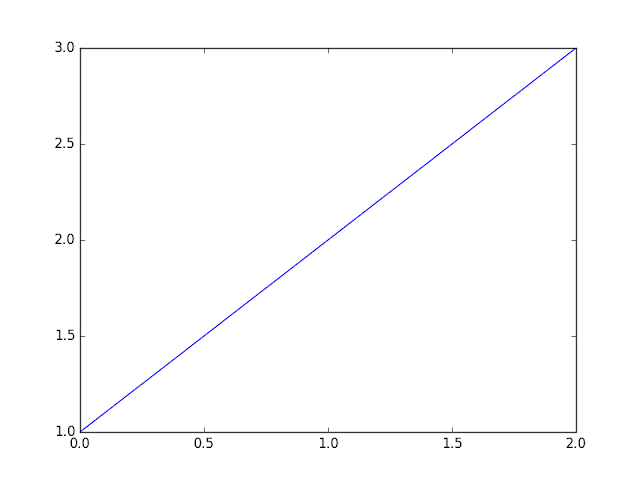
plt.plot([1,2,3])
plt.savefig('myfig')
Command:
$ chmod +x testplotandsavefig.py
$ ./testplotandsavefig.py
Result:
Traceback (most recent call last):
File "./testplotandsavefig.py", line 2, in <module>
import matplotlib
ImportError: No module named matplotlib
Command (Installing matplotlib):
$ brew install matplotlib
Result:
==> Auto-updated Homebrew!
Updated Homebrew from 6e57355 to e4ed309.
Updated 2 taps (homebrew/core, homebrew/science).
==> New Formulae
gofabric8 httpdiff linkerd
==> Updated Formulae
airspy openssl ✔
antigen openssl@1.1
argyll-cms pgrouting
cgal postgis
chaiscript protobuf-swift
consul-template purescript
fzf sfcgal
homebrew/science/exabayes spdylay
homebrew/science/nextflow storm
homebrew/science/sortmerna the_silver_searcher
homebrew/science/vtk varnish
jetty vim ✔
jsoncpp wellington
launch wolfssl
legit yle-dl
libpointing you-get
mobile-shell zplug
nghttp2
==> Deleted Formulae
aeskeyfind
==> Installing matplotlib from homebrew/python
==> Downloading https://pypi.python.org/packages/source/m/matplotlib/matplotlib-
######################################################################## 100.0%
==> Downloading https://pypi.python.org/packages/source/s/setuptools/setuptools-
######################################################################## 100.0%
==> python -c import setuptools... --no-user-cfg install --prefix=/usr/local/Cel
==> Downloading https://pypi.python.org/packages/source/C/Cycler/cycler-0.9.0.ta
######################################################################## 100.0%
==> python -c import setuptools... --no-user-cfg install --prefix=/usr/local/Cel
==> Downloading https://pypi.python.org/packages/source/f/funcsigs/funcsigs-0.4.
######################################################################## 100.0%
==> python -c import setuptools... --no-user-cfg install --prefix=/usr/local/Cel
==> Downloading https://pypi.python.org/packages/source/n/nose/nose-1.3.7.tar.gz
######################################################################## 100.0%
==> python -c import setuptools... --no-user-cfg install --prefix=/usr/local/Cel
==> Downloading https://pypi.python.org/packages/source/m/mock/mock-1.3.0.tar.gz
######################################################################## 100.0%
==> python -c import setuptools... --no-user-cfg install --prefix=/usr/local/Cel
==> Downloading https://pypi.python.org/packages/source/p/pbr/pbr-1.8.1.tar.gz
######################################################################## 100.0%
==> python -c import setuptools... --no-user-cfg install --prefix=/usr/local/Cel
==> Downloading https://pypi.python.org/packages/source/p/pyparsing/pyparsing-2.
######################################################################## 100.0%
==> python -c import setuptools... --no-user-cfg install --prefix=/usr/local/Cel
==> Downloading https://pypi.python.org/packages/source/p/python-dateutil/python
######################################################################## 100.0%
==> python -c import setuptools... --no-user-cfg install --prefix=/usr/local/Cel
==> Downloading https://pypi.python.org/packages/source/p/pytz/pytz-2015.7.tar.b
######################################################################## 100.0%
==> python -c import setuptools... --no-user-cfg install --prefix=/usr/local/Cel
==> Downloading https://pypi.python.org/packages/source/s/six/six-1.10.0.tar.gz
######################################################################## 100.0%
==> python -c import setuptools... --no-user-cfg install --prefix=/usr/local/Cel
==> python -c import setuptools... --no-user-cfg install --prefix=/usr/local/Cel
==> Caveats
If you want to use the `wxagg` backend, do `brew install wxpython`.
This can be done even after the matplotlib install.
==> Summary
🍺 /usr/local/Cellar/matplotlib/1.5.1: 3,513 files, 76.5M, built in 1 minute 15 seconds
Command:
$ ./testplotandsavefig.py
Result (Error):
Traceback (most recent call last):
File "./testplotandsavefig.py", line 2, in <module>
import matplotlib
File "/usr/local/lib/python2.7/site-packages/matplotlib/__init__.py", line 1131, in <module>
rcParams = rc_params()
File "/usr/local/lib/python2.7/site-packages/matplotlib/__init__.py", line 975, in rc_params
return rc_params_from_file(fname, fail_on_error)
File "/usr/local/lib/python2.7/site-packages/matplotlib/__init__.py", line 1100, in rc_params_from_file
config_from_file = _rc_params_in_file(fname, fail_on_error)
File "/usr/local/lib/python2.7/site-packages/matplotlib/__init__.py", line 1018, in _rc_params_in_file
with _open_file_or_url(fname) as fd:
File "/usr/local/Cellar/python/2.7.12/Frameworks/Python.framework/Versions/2.7/lib/python2.7/contextlib.py", line 17, in __enter__
return self.gen.next()
File "/usr/local/lib/python2.7/site-packages/matplotlib/__init__.py", line 1000, in _open_file_or_url
encoding = locale.getdefaultlocale()[1]
File "/usr/local/Cellar/python/2.7.12/Frameworks/Python.framework/Versions/2.7/lib/python2.7/locale.py", line 545, in getdefaultlocale
return _parse_localename(localename)
File "/usr/local/Cellar/python/2.7.12/Frameworks/Python.framework/Versions/2.7/lib/python2.7/locale.py", line 477, in _parse_localename
raise ValueError, 'unknown locale: %s' % localename
ValueError: unknown locale: UTF-8
Command:
$ locale
Result:
LANG=
LC_COLLATE="C"
LC_CTYPE="UTF-8"
LC_MESSAGES="C"
LC_MONETARY="C"
LC_NUMERIC="C"
LC_TIME="C"
LC_ALL=
Command (Fixing locale):
$ LC_CTYPE="C"
$ locale
Result:
LANG=
LC_COLLATE="C"
LC_CTYPE="C"
LC_MESSAGES="C"
LC_MONETARY="C"
LC_NUMERIC="C"
LC_TIME="C"
LC_ALL=
Command:
$ ./testplotandsavefig.py
Result:
/usr/local/lib/python2.7/site-packages/matplotlib/font_manager.py:273: UserWarning: Matplotlib is building the font cache using fc-list. This may take a moment.
warnings.warn('Matplotlib is building the font cache using fc-list. This may take a moment.')
Command:
$ ls myfig*
Result:
myfig.png
Command (Opening image file):
$ open myfig.png