Thursday, September 29, 2016

Python: Matplotlib: Mathtext Examples

Noteworthy:

matplotlib.pyplot.fill_between()


Command:

$ cat Downloads/mathtext_examples.py


Result:

"""
Selected features of Matplotlib's math rendering engine.
"""
from __future__ import print_function
import matplotlib.pyplot as plt
import os
import sys
import re
import gc

# Selection of features following "Writing mathematical expressions" tutorial
mathtext_titles = {
    0: "Header demo",
    1: "Subscripts and superscripts",
    2: "Fractions, binomials and stacked numbers",
    3: "Radicals",
    4: "Fonts",
    5: "Accents",
    6: "Greek, Hebrew",
    7: "Delimiters, functions and Symbols"}
n_lines = len(mathtext_titles)

# Randomly picked examples
mathext_demos = {
    0: r"$W^{3\beta}_{\delta_1 \rho_1 \sigma_2} = "
    r"U^{3\beta}_{\delta_1 \rho_1} + \frac{1}{8 \pi 2} "
    r"\int^{\alpha_2}_{\alpha_2} d \alpha^\prime_2 \left[\frac{ "
    r"U^{2\beta}_{\delta_1 \rho_1} - \alpha^\prime_2U^{1\beta}_"
    r"{\rho_1 \sigma_2} }{U^{0\beta}_{\rho_1 \sigma_2}}\right]$",

    1: r"$\alpha_i > \beta_i,\ "
    r"\alpha_{i+1}^j = {\rm sin}(2\pi f_j t_i) e^{-5 t_i/\tau},\ "
    r"\ldots$",

    2: r"$\frac{3}{4},\ \binom{3}{4},\ \stackrel{3}{4},\ "
    r"\left(\frac{5 - \frac{1}{x}}{4}\right),\ \ldots$",

    3: r"$\sqrt{2},\ \sqrt[3]{x},\ \ldots$",

    4: r"$\mathrm{Roman}\ , \ \mathit{Italic}\ , \ \mathtt{Typewriter} \ "
    r"\mathrm{or}\ \mathcal{CALLIGRAPHY}$",

    5: r"$\acute a,\ \bar a,\ \breve a,\ \dot a,\ \ddot a, \ \grave a, \ "
    r"\hat a,\ \tilde a,\ \vec a,\ \widehat{xyz},\ \widetilde{xyz},\ "
    r"\ldots$",

    6: r"$\alpha,\ \beta,\ \chi,\ \delta,\ \lambda,\ \mu,\ "
    r"\Delta,\ \Gamma,\ \Omega,\ \Phi,\ \Pi,\ \Upsilon,\ \nabla,\ "
    r"\aleph,\ \beth,\ \daleth,\ \gimel,\ \ldots$",

    7: r"$\coprod,\ \int,\ \oint,\ \prod,\ \sum,\ "
    r"\log,\ \sin,\ \approx,\ \oplus,\ \star,\ \varpropto,\ "
    r"\infty,\ \partial,\ \Re,\ \leftrightsquigarrow, \ \ldots$"}


def doall():
    # Colors used in mpl online documentation.
    mpl_blue_rvb = (191./255., 209./256., 212./255.)
    mpl_orange_rvb = (202/255., 121/256., 0./255.)
    mpl_grey_rvb = (51./255., 51./255., 51./255.)

    # Creating figure and axis.
    plt.figure(figsize=(6, 7))
    plt.axes([0.01, 0.01, 0.98, 0.90], axisbg="white", frameon=True)
    plt.gca().set_xlim(0., 1.)
    plt.gca().set_ylim(0., 1.)
    plt.gca().set_title("Matplotlib's math rendering engine",
                        color=mpl_grey_rvb, fontsize=14, weight='bold')
    plt.gca().set_xticklabels("", visible=False)
    plt.gca().set_yticklabels("", visible=False)

    # Gap between lines in axes coords
    line_axesfrac = (1. / (n_lines))

    # Plotting header demonstration formula
    full_demo = mathext_demos[0]
    plt.annotate(full_demo,
                 xy=(0.5, 1. - 0.59*line_axesfrac),
                 xycoords='data', color=mpl_orange_rvb, ha='center',
                 fontsize=20)

    # Plotting features demonstration formulae
    for i_line in range(1, n_lines):
        baseline = 1. - (i_line)*line_axesfrac
        baseline_next = baseline - line_axesfrac*1.
        title = mathtext_titles[i_line] + ":"
        fill_color = ['white', mpl_blue_rvb][i_line % 2]
        plt.fill_between([0., 1.], [baseline, baseline],
                         [baseline_next, baseline_next],
                         color=fill_color, alpha=0.5)
        plt.annotate(title,
                     xy=(0.07, baseline - 0.3*line_axesfrac),
                     xycoords='data', color=mpl_grey_rvb, weight='bold')
        demo = mathext_demos[i_line]
        plt.annotate(demo,
                     xy=(0.05, baseline - 0.75*line_axesfrac),
                     xycoords='data', color=mpl_grey_rvb,
                     fontsize=16)

    for i in range(n_lines):
        s = mathext_demos[i]
        print(i, s)
    plt.savefig('pyplot_mathtext_examples.png')

if '--latex' in sys.argv:
    # Run: python mathtext_examples.py --latex
    # Need amsmath and amssymb packages.
    fd = open("mathtext_examples.ltx", "w")
    fd.write("\\documentclass{article}\n")
    fd.write("\\usepackage{amsmath, amssymb}\n")
    fd.write("\\begin{document}\n")
    fd.write("\\begin{enumerate}\n")

    for i in range(n_lines):
        s = mathext_demos[i]
        s = re.sub(r"(?<!\\)\$", "$$", s)
        fd.write("\\item %s\n" % s)

    fd.write("\\end{enumerate}\n")
    fd.write("\\end{document}\n")
    fd.close()

    os.system("pdflatex mathtext_examples.ltx")
else:
    doall()


Command:

$ python Downloads/mathtext_examples.py


Result:

0 $W^{3\beta}_{\delta_1 \rho_1 \sigma_2} = U^{3\beta}_{\delta_1 \rho_1} + \frac{1}{8 \pi 2} \int^{\alpha_2}_{\alpha_2} d \alpha^\prime_2 \left[\frac{ U^{2\beta}_{\delta_1 \rho_1} - \alpha^\prime_2U^{1\beta}_{\rho_1 \sigma_2} }{U^{0\beta}_{\rho_1 \sigma_2}}\right]$
1 $\alpha_i > \beta_i,\ \alpha_{i+1}^j = {\rm sin}(2\pi f_j t_i) e^{-5 t_i/\tau},\ \ldots$
2 $\frac{3}{4},\ \binom{3}{4},\ \stackrel{3}{4},\ \left(\frac{5 - \frac{1}{x}}{4}\right),\ \ldots$
3 $\sqrt{2},\ \sqrt[3]{x},\ \ldots$
4 $\mathrm{Roman}\ , \ \mathit{Italic}\ , \ \mathtt{Typewriter} \ \mathrm{or}\ \mathcal{CALLIGRAPHY}$
5 $\acute a,\ \bar a,\ \breve a,\ \dot a,\ \ddot a, \ \grave a, \ \hat a,\ \tilde a,\ \vec a,\ \widehat{xyz},\ \widetilde{xyz},\ \ldots$
6 $\alpha,\ \beta,\ \chi,\ \delta,\ \lambda,\ \mu,\ \Delta,\ \Gamma,\ \Omega,\ \Phi,\ \Pi,\ \Upsilon,\ \nabla,\ \aleph,\ \beth,\ \daleth,\ \gimel,\ \ldots$
7 $\coprod,\ \int,\ \oint,\ \prod,\ \sum,\ \log,\ \sin,\ \approx,\ \oplus,\ \star,\ \varpropto,\ \infty,\ \partial,\ \Re,\ \leftrightsquigarrow, \ \ldots$


Graphical output:

pyplot_mathtext_examples.png


Python: Matplotlib: XKCD-Style Sketch Plot Example

Noteworthy:

matplotlib.pyplot.xkcd()
matplotlib.pyplot.annotate()


Command:

$ cat Downloads/xkcd.py


Result:

import matplotlib.pyplot as plt
import numpy as np

with plt.xkcd():
    # Based on "Stove Ownership" from XKCD by Randall Monroe
    # http://xkcd.com/418/

    fig = plt.figure()
    ax = fig.add_axes((0.1, 0.2, 0.8, 0.7))
    ax.spines['right'].set_color('none')
    ax.spines['top'].set_color('none')
    plt.xticks([])
    plt.yticks([])
    ax.set_ylim([-30, 10])

    data = np.ones(100)
    data[70:] -= np.arange(30)

    plt.annotate(
        'THE DAY I REALIZED\nI COULD COOK BACON\nWHENEVER I WANTED',
        xy=(70, 1), arrowprops=dict(arrowstyle='->'), xytext=(15, -10))

    plt.plot(data)

    plt.xlabel('time')
    plt.ylabel('my overall health')
    fig.text(
        0.5, 0.05,
        '"Stove Ownership" from xkcd by Randall Monroe',
        ha='center')

    plt.savefig('pyplot_xkcd_figure1.png')

    # Based on "The Data So Far" from XKCD by Randall Monroe
    # http://xkcd.com/373/

    fig = plt.figure()
    ax = fig.add_axes((0.1, 0.2, 0.8, 0.7))
    ax.bar([-0.125, 1.0 - 0.125], [0, 100], 0.25)
    ax.spines['right'].set_color('none')
    ax.spines['top'].set_color('none')
    ax.xaxis.set_ticks_position('bottom')
    ax.set_xticks([0, 1])
    ax.set_xlim([-0.5, 1.5])
    ax.set_ylim([0, 110])
    ax.set_xticklabels(['CONFIRMED BY\nEXPERIMENT', 'REFUTED BY\nEXPERIMENT'])
    plt.yticks([])

    plt.title("CLAIMS OF SUPERNATURAL POWERS")

    fig.text(
        0.5, 0.05,
        '"The Data So Far" from xkcd by Randall Monroe',
        ha='center')
   
    plt.savefig('pyplot_xkcd_figure2.png')

plt.show()


Graphical output:

pyplot_xkcd_figure1.png
pyplot_xkcd_figure2.png

Leonard Susskind: Arguments for Agnosticism?

Python: Matplotlib: Polar Plot Example

Noteworthy:

ax.set_rmax()


Command:

$ cat Downloads/polar_demo.py


Result:

"""
Demo of a line plot on a polar axis.
"""
import numpy as np
import matplotlib.pyplot as plt

plt.style.use('dark_background')
r = np.arange(0, 3.0, 0.01)
theta = 2 * np.pi * r

ax = plt.subplot(111, projection='polar')
ax.plot(theta, r, color='r', linewidth=3)
ax.set_rmax(2.0)
ax.grid(True)

ax.set_title("A line plot on a polar axis", va='bottom')
plt.savefig('pyplot_polar_demo.png')


Graphical output:

pyplot_polar_demo.png

Python: Matplotlib: Logarithm Example

Noteworthy:

matplotlib.pyplot.subplots_adjust()
numpy.arange()
matplotlib.pyplot.semilogy()
matplotlib.pyplot.semilogx()
matplotlib.pyplot.loglog()
matplotlib.pyplot.errorbar()


Command:

$ cat Downloads/log_demo.py


Result:

import numpy as np
import matplotlib.pyplot as plt

plt.style.use('dark_background')
plt.subplots_adjust(hspace=0.4)
t = np.arange(0.01, 20.0, 0.01)

# log y axis
plt.subplot(221)
plt.semilogy(t, np.exp(-t/5.0))
plt.title('semilogy')
plt.grid(True)

# log x axis
plt.subplot(222)
plt.semilogx(t, np.sin(2*np.pi*t))
plt.title('semilogx')
plt.grid(True)

# log x and y axis
plt.subplot(223)
plt.loglog(t, 20*np.exp(-t/10.0), basex=2)
plt.grid(True)
plt.title('loglog base 4 on x')

# with errorbars: clip non-positive values
ax = plt.subplot(224)
ax.set_xscale("log", nonposx='clip')
ax.set_yscale("log", nonposy='clip')

x = 10.0**np.linspace(0.0, 2.0, 20)
y = x**2.0
plt.errorbar(x, y, xerr=0.1*x, yerr=5.0 + 0.75*y)
ax.set_ylim(ymin=0.1)
ax.set_title('Errorbars go negative')

plt.savefig('pyplot_log_demo.png')


Command:

$ python Downloads/log_demo.py


Graphical output:

pyplot_log_demo..png


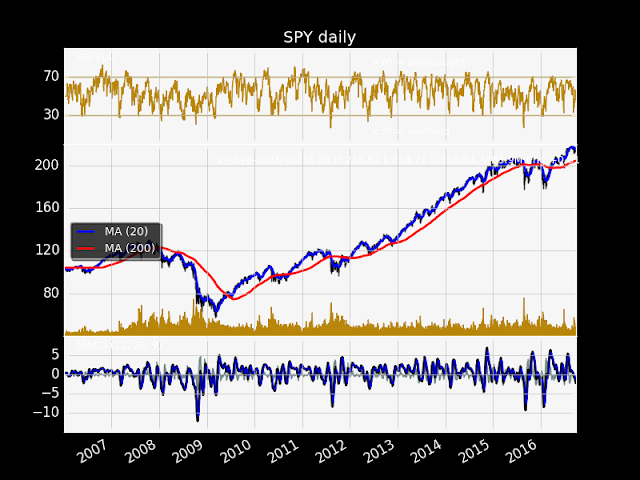
Python: Matplotlib: Finance Example

Noteworthy:

datetime.date(2006, 1, 1)
datetime.date.today()
finance.fetch_historical_yahoo(ticker, startdate, enddate)
mlab.csv2rec(fh)
fh.close()
r.sort()
np.asarray(x)
np.ones(n)
weights.sum()
np.convolve(x, weights, mode='full')[:len(x)]
np.diff(prices)
np.zeros_like(prices)
...


Command:

$ cat Downloads/finance_work2.py


Result:

import datetime
import numpy as np
import matplotlib.colors as colors
import matplotlib.finance as finance
import matplotlib.dates as mdates
import matplotlib.ticker as mticker
import matplotlib.mlab as mlab
import matplotlib.pyplot as plt
import matplotlib.font_manager as font_manager

plt.style.use('dark_background')

startdate = datetime.date(2006, 1, 1)
today = enddate = datetime.date.today()
ticker = 'SPY'

fh = finance.fetch_historical_yahoo(ticker, startdate, enddate)
# a numpy record array with fields: date, open, high, low, close, volume, adj_close)

r = mlab.csv2rec(fh)
fh.close()
r.sort()

def moving_average(x, n, type='simple'):
    """
    compute an n period moving average.

    type is 'simple' | 'exponential'

    """
    x = np.asarray(x)
    if type == 'simple':
        weights = np.ones(n)
    else:
        weights = np.exp(np.linspace(-1., 0., n))

    weights /= weights.sum()

    a = np.convolve(x, weights, mode='full')[:len(x)]
    a[:n] = a[n]
    return a

def relative_strength(prices, n=14):
    """
    compute the n period relative strength indicator
    http://stockcharts.com/school/doku.php?id=chart_school:glossary_r#relativestrengthindex
    http://www.investopedia.com/terms/r/rsi.asp
    """

    deltas = np.diff(prices)
    seed = deltas[:n+1]
    up = seed[seed >= 0].sum()/n
    down = -seed[seed < 0].sum()/n
    rs = up/down
    rsi = np.zeros_like(prices)
    rsi[:n] = 100. - 100./(1. + rs)

    for i in range(n, len(prices)):
        delta = deltas[i - 1]  # cause the diff is 1 shorter

        if delta > 0:
            upval = delta
            downval = 0.
        else:
            upval = 0.
            downval = -delta

        up = (up*(n - 1) + upval)/n
        down = (down*(n - 1) + downval)/n

        rs = up/down
        rsi[i] = 100. - 100./(1. + rs)

    return rsi

def moving_average_convergence(x, nslow=26, nfast=12):
    """
    compute the MACD (Moving Average Convergence/Divergence) using a fast and slow exponential moving avg'
    return value is emaslow, emafast, macd which are len(x) arrays
    """
    emaslow = moving_average(x, nslow, type='exponential')
    emafast = moving_average(x, nfast, type='exponential')
    return emaslow, emafast, emafast - emaslow

plt.rc('axes', grid=True)
plt.rc('grid', color='0.75', linestyle='-', linewidth=0.5)

textsize = 9
left, width = 0.1, 0.8
rect1 = [left, 0.7, width, 0.2]
rect2 = [left, 0.3, width, 0.4]
rect3 = [left, 0.1, width, 0.2]

fig = plt.figure(facecolor='white')
axescolor = '#f6f6f6'  # the axes background color

ax1 = fig.add_axes(rect1, axisbg=axescolor)  # left, bottom, width, height
ax2 = fig.add_axes(rect2, axisbg=axescolor, sharex=ax1)
ax2t = ax2.twinx()
ax3 = fig.add_axes(rect3, axisbg=axescolor, sharex=ax1)

# plot the relative strength indicator
prices = r.adj_close
rsi = relative_strength(prices)
fillcolor = 'darkgoldenrod'

ax1.plot(r.date, rsi, color=fillcolor)
ax1.axhline(70, color=fillcolor)
ax1.axhline(30, color=fillcolor)
ax1.fill_between(r.date, rsi, 70, where=(rsi >= 70), facecolor=fillcolor, edgecolor=fillcolor)
ax1.fill_between(r.date, rsi, 30, where=(rsi <= 30), facecolor=fillcolor, edgecolor=fillcolor)
ax1.text(0.6, 0.9, '>70 = overbought', va='top', transform=ax1.transAxes, fontsize=textsize)
ax1.text(0.6, 0.1, '<30 = oversold', transform=ax1.transAxes, fontsize=textsize)
ax1.set_ylim(0, 100)
ax1.set_yticks([30, 70])
ax1.text(0.025, 0.95, 'RSI (14)', va='top', transform=ax1.transAxes, fontsize=textsize)
ax1.set_title('%s daily' % ticker)

# plot the price and volume data
dx = r.adj_close - r.close
low = r.low + dx
high = r.high + dx

deltas = np.zeros_like(prices)
deltas[1:] = np.diff(prices)
up = deltas > 0
ax2.vlines(r.date[up], low[up], high[up], color='black', label='_nolegend_')
ax2.vlines(r.date[~up], low[~up], high[~up], color='black', label='_nolegend_')
ma20 = moving_average(prices, 20, type='simple')
ma200 = moving_average(prices, 200, type='simple')

linema20, = ax2.plot(r.date, ma20, color='blue', lw=2, label='MA (20)')
linema200, = ax2.plot(r.date, ma200, color='red', lw=2, label='MA (200)')

last = r[-1]
s = '%s O:%1.2f H:%1.2f L:%1.2f C:%1.2f, V:%1.1fM Chg:%+1.2f' % (
    today.strftime('%d-%b-%Y'),
    last.open, last.high,
    last.low, last.close,
    last.volume*1e-6,
    last.close - last.open)
t4 = ax2.text(0.3, 0.9, s, transform=ax2.transAxes, fontsize=textsize)

props = font_manager.FontProperties(size=10)
leg = ax2.legend(loc='center left', shadow=True, fancybox=True, prop=props)
leg.get_frame().set_alpha(0.5)

volume = (r.close*r.volume)/1e6  # dollar volume in millions
vmax = volume.max()
poly = ax2t.fill_between(r.date, volume, 0, label='Volume', facecolor=fillcolor, edgecolor=fillcolor)
ax2t.set_ylim(0, 5*vmax)
ax2t.set_yticks([])

# compute the MACD indicator
fillcolor = 'darkslategrey'
nslow = 26
nfast = 12
nema = 9
emaslow, emafast, macd = moving_average_convergence(prices, nslow=nslow, nfast=nfast)
ema9 = moving_average(macd, nema, type='exponential')
ax3.plot(r.date, macd, color='black', lw=2)
ax3.plot(r.date, ema9, color='blue', lw=1)
ax3.fill_between(r.date, macd - ema9, 0, alpha=0.5, facecolor=fillcolor, edgecolor=fillcolor)

ax3.text(0.025, 0.95, 'MACD (%d, %d, %d)' % (nfast, nslow, nema), va='top',
         transform=ax3.transAxes, fontsize=textsize)

#ax3.set_yticks([])
# turn off upper axis tick labels, rotate the lower ones, etc
for ax in ax1, ax2, ax2t, ax3:
    if ax != ax3:
        for label in ax.get_xticklabels():
            label.set_visible(False)
    else:
        for label in ax.get_xticklabels():
            label.set_rotation(30)
            label.set_horizontalalignment('right')

    ax.fmt_xdata = mdates.DateFormatter('%Y-%m-%d')

class MyLocator(mticker.MaxNLocator):
    def __init__(self, *args, **kwargs):
        mticker.MaxNLocator.__init__(self, *args, **kwargs)

    def __call__(self, *args, **kwargs):
        return mticker.MaxNLocator.__call__(self, *args, **kwargs)

# at most 5 ticks, pruning the upper and lower so they don't overlap
# with other ticks
#ax2.yaxis.set_major_locator(mticker.MaxNLocator(5, prune='both'))
#ax3.yaxis.set_major_locator(mticker.MaxNLocator(5, prune='both'))

ax2.yaxis.set_major_locator(MyLocator(5, prune='both'))
ax3.yaxis.set_major_locator(MyLocator(5, prune='both'))

plt.savefig("pyplot_finance_work2.png")


Graphical output:

pyplot_finance_work2.png


Python: Matplotlib: Fill Example

Noteworthy:

matplotlib.pyplot.fill()


Command:

$ cat Downloads/fill_demo.py


Result:

"""
Simple demo of the fill function.
"""
import numpy as np
import matplotlib.pyplot as plt

plt.style.use('dark_background')

x = np.linspace(0, 1)
y = np.sin(4 * np.pi * x) * np.exp(-5 * x)

plt.fill(x, y, 'r')
plt.grid(True)

plt.savefig("pyplot_fill.png")


Command:

$ python Downloads/fill_demo.py 
$ open pyplot_fill.png 


Graphical output:


Python: Matplotlib: Pie Chart Example

Noteworthy:

matplotlib.pyplot.pie()
ax.pie()
ax.set_xticks()
ax.set_yticks()
ax.set_xticklabels()
ax.set_yticklabels()
ax.set_xlim()
ax.set_ylim()
ax.set_aspect()


Command:

$ cat Downloads/pie_demo_features.py


Result:

"""
Demo of a basic pie chart plus a few additional features.

In addition to the basic pie chart, this demo shows a few optional features:

    * slice labels
    * auto-labeling the percentage
    * offsetting a slice with "explode"
    * drop-shadow
    * custom start angle

Note about the custom start angle:

The default ``startangle`` is 0, which would start the "Frogs" slice on the
positive x-axis. This example sets ``startangle = 90`` such that everything is
rotated counter-clockwise by 90 degrees, and the frog slice starts on the
positive y-axis.
"""
import matplotlib.pyplot as plt

plt.style.use('dark_background')

# The slices will be ordered and plotted counter-clockwise.
labels = 'Frogs', 'Hogs', 'Dogs', 'Logs'
sizes = [15, 30, 45, 10]
colors = ['yellowgreen', 'gold', 'lightskyblue', 'lightcoral']
explode = (0, 0.1, 0, 0)  # only "explode" the 2nd slice (i.e. 'Hogs')

plt.pie(sizes, explode=explode, labels=labels, colors=colors,
        autopct='%1.1f%%', shadow=True, startangle=90)
# Set aspect ratio to be equal so that pie is drawn as a circle.
plt.axis('equal')

fig = plt.figure()
ax = fig.gca()
import numpy as np

ax.pie(np.random.random(4), explode=explode, labels=labels, colors=colors,
       autopct='%1.1f%%', shadow=True, startangle=90,
       radius=0.25, center=(0, 0), frame=True)
ax.pie(np.random.random(4), explode=explode, labels=labels, colors=colors,
       autopct='%1.1f%%', shadow=True, startangle=90,
       radius=0.25, center=(1, 1), frame=True)
ax.pie(np.random.random(4), explode=explode, labels=labels, colors=colors,
       autopct='%1.1f%%', shadow=True, startangle=90,
       radius=0.25, center=(0, 1), frame=True)
ax.pie(np.random.random(4), explode=explode, labels=labels, colors=colors,
       autopct='%1.1f%%', shadow=True, startangle=90,
       radius=0.25, center=(1, 0), frame=True)

ax.set_xticks([0, 1])
ax.set_yticks([0, 1])
ax.set_xticklabels(["Sunny", "Cloudy"])
ax.set_yticklabels(["Dry", "Rainy"])
ax.set_xlim((-0.5, 1.5))
ax.set_ylim((-0.5, 1.5))

# Set aspect ratio to be equal so that pie is drawn as a circle.
ax.set_aspect('equal')

plt.show()


Command:

$ python Downloads/pie_demo_features.py


Graphical output:

Figure 1
Figure 2


Python: Matplotlib: Path Example

Noteworthy:

matplotlib.path.Path
Path.MOVETO
Path.CURVE4
Path.LINETO
Path.CLOSEPOLY
matplotlib.patches.PathPatch()
ax.add_patch()
zip()
path.vertices
ax.grid()
ax.axis()


Command:

$ cat Downloads/path_patch_demo.py


Result:

"""
Demo of a PathPatch object.
"""
import matplotlib.path as mpath
import matplotlib.patches as mpatches
import matplotlib.pyplot as plt

plt.style.use('dark_background')

fig, ax = plt.subplots()

Path = mpath.Path
path_data = [
    (Path.MOVETO, (1.58, -2.57)),
    (Path.CURVE4, (0.35, -1.1)),
    (Path.CURVE4, (-1.75, 2.0)),
    (Path.CURVE4, (0.375, 2.0)),
    (Path.LINETO, (0.85, 1.15)),
    (Path.CURVE4, (2.2, 3.2)),
    (Path.CURVE4, (3, 0.05)),
    (Path.CURVE4, (2.0, -0.5)),
    (Path.CLOSEPOLY, (1.58, -2.57)),
    ]
codes, verts = zip(*path_data)
path = mpath.Path(verts, codes)
patch = mpatches.PathPatch(path, facecolor='r', alpha=0.5)
ax.add_patch(patch)

# plot control points and connecting lines
x, y = zip(*path.vertices)
line, = ax.plot(x, y, 'go-')

ax.grid()
ax.axis('equal')
plt.show()


Command:

$ python Downloads/path_patch_demo.py


Graphical output:


Wednesday, September 28, 2016

Roger Walsh: Closer to Truth: Why is Consciousness so Baffling?

Roger Walsh

  • polyphasic culture
  • experiential map
  • EEG

George Lakoff: Closer to Truth: Why is Consciousness so Baffling?

George Lakoff

Ken Mogi: Closer to Truth: What Is Consciousness?

Ken Mogi

Python: Matplotlib: Streamplot (2D Vector Field) Example

Noteworthy:

numpy.mgrid
numpy.sqrt
matplotlib.pyplot.subplots()
matplotlib.pyplot.cm.autumn
streamplot()
strm.linesspeed.max()


Command:

$ cat Downloads/streamplot_demo_features.py


Result:

"""
Demo of the `streamplot` function.

A streamplot, or streamline plot, is used to display 2D vector fields. This
example shows a few features of the stream plot function:

    * Varying the color along a streamline.
    * Varying the density of streamlines.
    * Varying the line width along a stream line.
"""
import numpy as np
import matplotlib.pyplot as plt

plt.style.use('dark_background')

Y, X = np.mgrid[-3:3:100j, -3:3:100j]
U = -1 - X**2 + Y
V = 1 + X - Y**2
speed = np.sqrt(U*U + V*V)

fig0, ax0 = plt.subplots()
strm = ax0.streamplot(X, Y, U, V, color=U, linewidth=2, cmap=plt.cm.autumn)
fig0.colorbar(strm.lines)

fig1, (ax1, ax2) = plt.subplots(ncols=2)
ax1.streamplot(X, Y, U, V, density=[0.5, 1])

lw = 5*speed / speed.max()
ax2.streamplot(X, Y, U, V, density=0.6, color='k', linewidth=lw)

plt.show()


Command:

$ python Downloads/streamplot_demo_features.py


Graphical output:

fig0

fig1 (w/ unknown error on right side)
fig1 (Normal background style)


Python: Matplotlib: Sine Function Example

Noteworthy:

numpy.sin()
numpy.pi


Command:

$ cat Downloads/simple_plot.py


Result:

import matplotlib.pyplot as plt
import numpy as np

t = np.arange(0.0, 2.0, 0.01)
s = np.sin(2*np.pi*t)
plt.plot(t, s)

plt.xlabel('time (s)')
plt.ylabel('voltage (mV)')
plt.title('About as simple as it gets, folks')
plt.grid(True)
plt.savefig("test.png")
plt.show()


Command:

$ python Downloads/simple_plot.py


Graphical output: